Developer dashboard is a new feature in SharePoint 2010 which provides performance and tracing information that can be used in debugging & trouble shooting performance issues (slow loading of SharePoint pages) and view trace information.
If some of the SharePoint end users come to you and complain that the page they use in SharePoint loads slow then it’s time for you to view developer dashboard and find out the query time and code blocks which take much of the time.
Before SharePoint 2010 the only way to debug SharePoint is to attach a debugger process and proceed. ULS logs in one way but it has heaps of data which makes the life of a developer hard to look in to it.,
Developer dashboard can be displayed in 2 modes – On & OnDemand
On – If it is in ON mode, it is viewable in all the pages that use the default master page.
OnDemand – If it is in OnDemand mode , a small icon is displayed on the right top corner of the page.The user can toggle between ON & OFF.
By default Developer dashboard is disabled by default. TO switch it ON there are a few ways
STSADM:
 stsadm -o setproperty -pn developer-dashboard -pv OnDemand
 stsadm -o setproperty -propertyname developer-dashboard -propertyvalue OnDemand
 stsadm -o setproperty -pn developer-dashboard -pv On
 stsadm -o setproperty -propertyname developer-dashboard -propertyvalue On
 stsadm -o setproperty -pn developer-dashboard -pv off
 stsadm -o setproperty -propertyname developer-dashboard -propertyvalue off
Power Shell:
“OnDemand” mode
 $ ddSettings = [Microsoft.SharePoint.Administration.SPWebService]::ContentService.DeveloperDashboardSettings;
 $ddSettings.DisplayLevel = “OnDemand”;
 $ddSettings.TraceEnabled = $true;
 $ddSettings.Update()
“On” mode
 $ddSettings = Microsoft.SharePoint.Administration.SPWebService]::ContentService.DeveloperDashboardSettings;
 $ddSettings.DisplayLevel = “On”;
 $ddSettings.TraceEnabled = $true;
 $ddSettings.Update()
“Off” mode (Disabled)
 $ddSettings = Microsoft.SharePoint.Administration.SPWebService]::ContentService.DeveloperDashboardSettings;
 $ddSettings.DisplayLevel = “Off”;
 $ddSettings.TraceEnabled = $true;
 $ddSettings.Update()
Object model code:
To turn it on demand
 SPWebService ConService = SPWebService.ContentService;
 ConService.DeveloperDashboardSettings.DisplayLevel = SPDeveloperDashboardLevel.OnDemand;
 ConService.DeveloperDashboardSettings.Update();
To turn it on
 SPWebService ConService = SPWebService.ContentService;
 ConService.DeveloperDashboardSettings.DisplayLevel = SPDeveloperDashboardLevel.On;
 ConService.DeveloperDashboardSettings.Update();
SPWebService ConService = SPWebService.ContentService;
ConService.DeveloperDashboardSettings.DisplayLevel = SPDeveloperDashboardLevel.On;
ConService.DeveloperDashboardSettings.Update();
To turn it off
 SPWebService ConService = SPWebService.ContentService;
 ConService.DeveloperDashboardSettings.DisplayLevel = SPDeveloperDashboardLevel.Off;
 ConService.DeveloperDashboardSettings.Update();
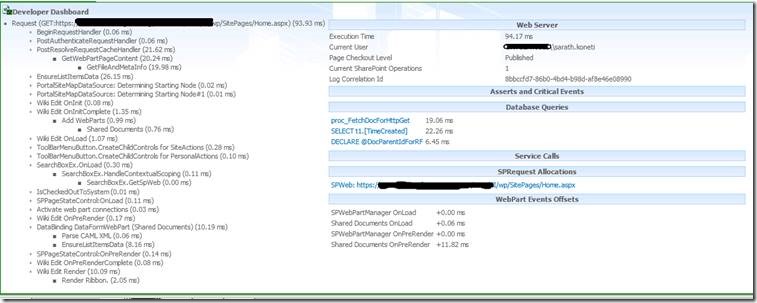
The small green colour image on the right top corner shows the developer dash board has been enabled OnDemand. Clicking it opens a section at the bottom of the page.
Developer dashboard information
The page requests and the time taken are displayed on the left hand side. Also the below page can be used to track the slow loading pages, web parts and can be helpful in identifying the root cause analysis of the issue & resolving the same.
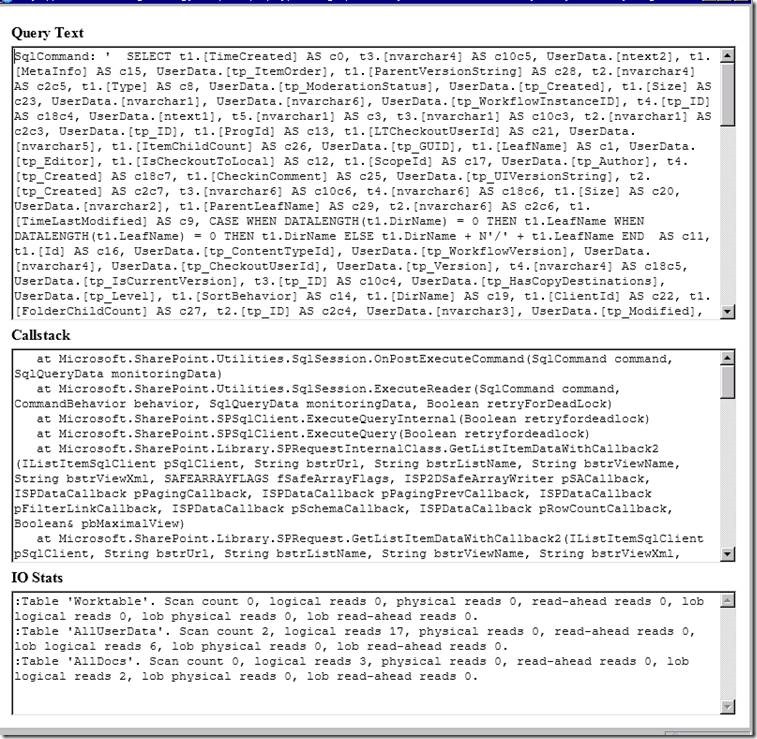
When we go and click SELECT link below in the database queries section
We get to know Query Text, Call Stack & IO Stats information
Happy Sharepointing!
Sarath Babu Koneti
SharePoint Consultant
Yes Labs Pty Ltd


Leave a comment